Accessing Course Statistics
To view statistics for a specific course, go to the “Courses” tab in the sidebar menu, open the landing page of the course you’re interested in, and click on the “Statistics” tab.
The system has different sections for you to use. You can export any statistical fields as .csv files.
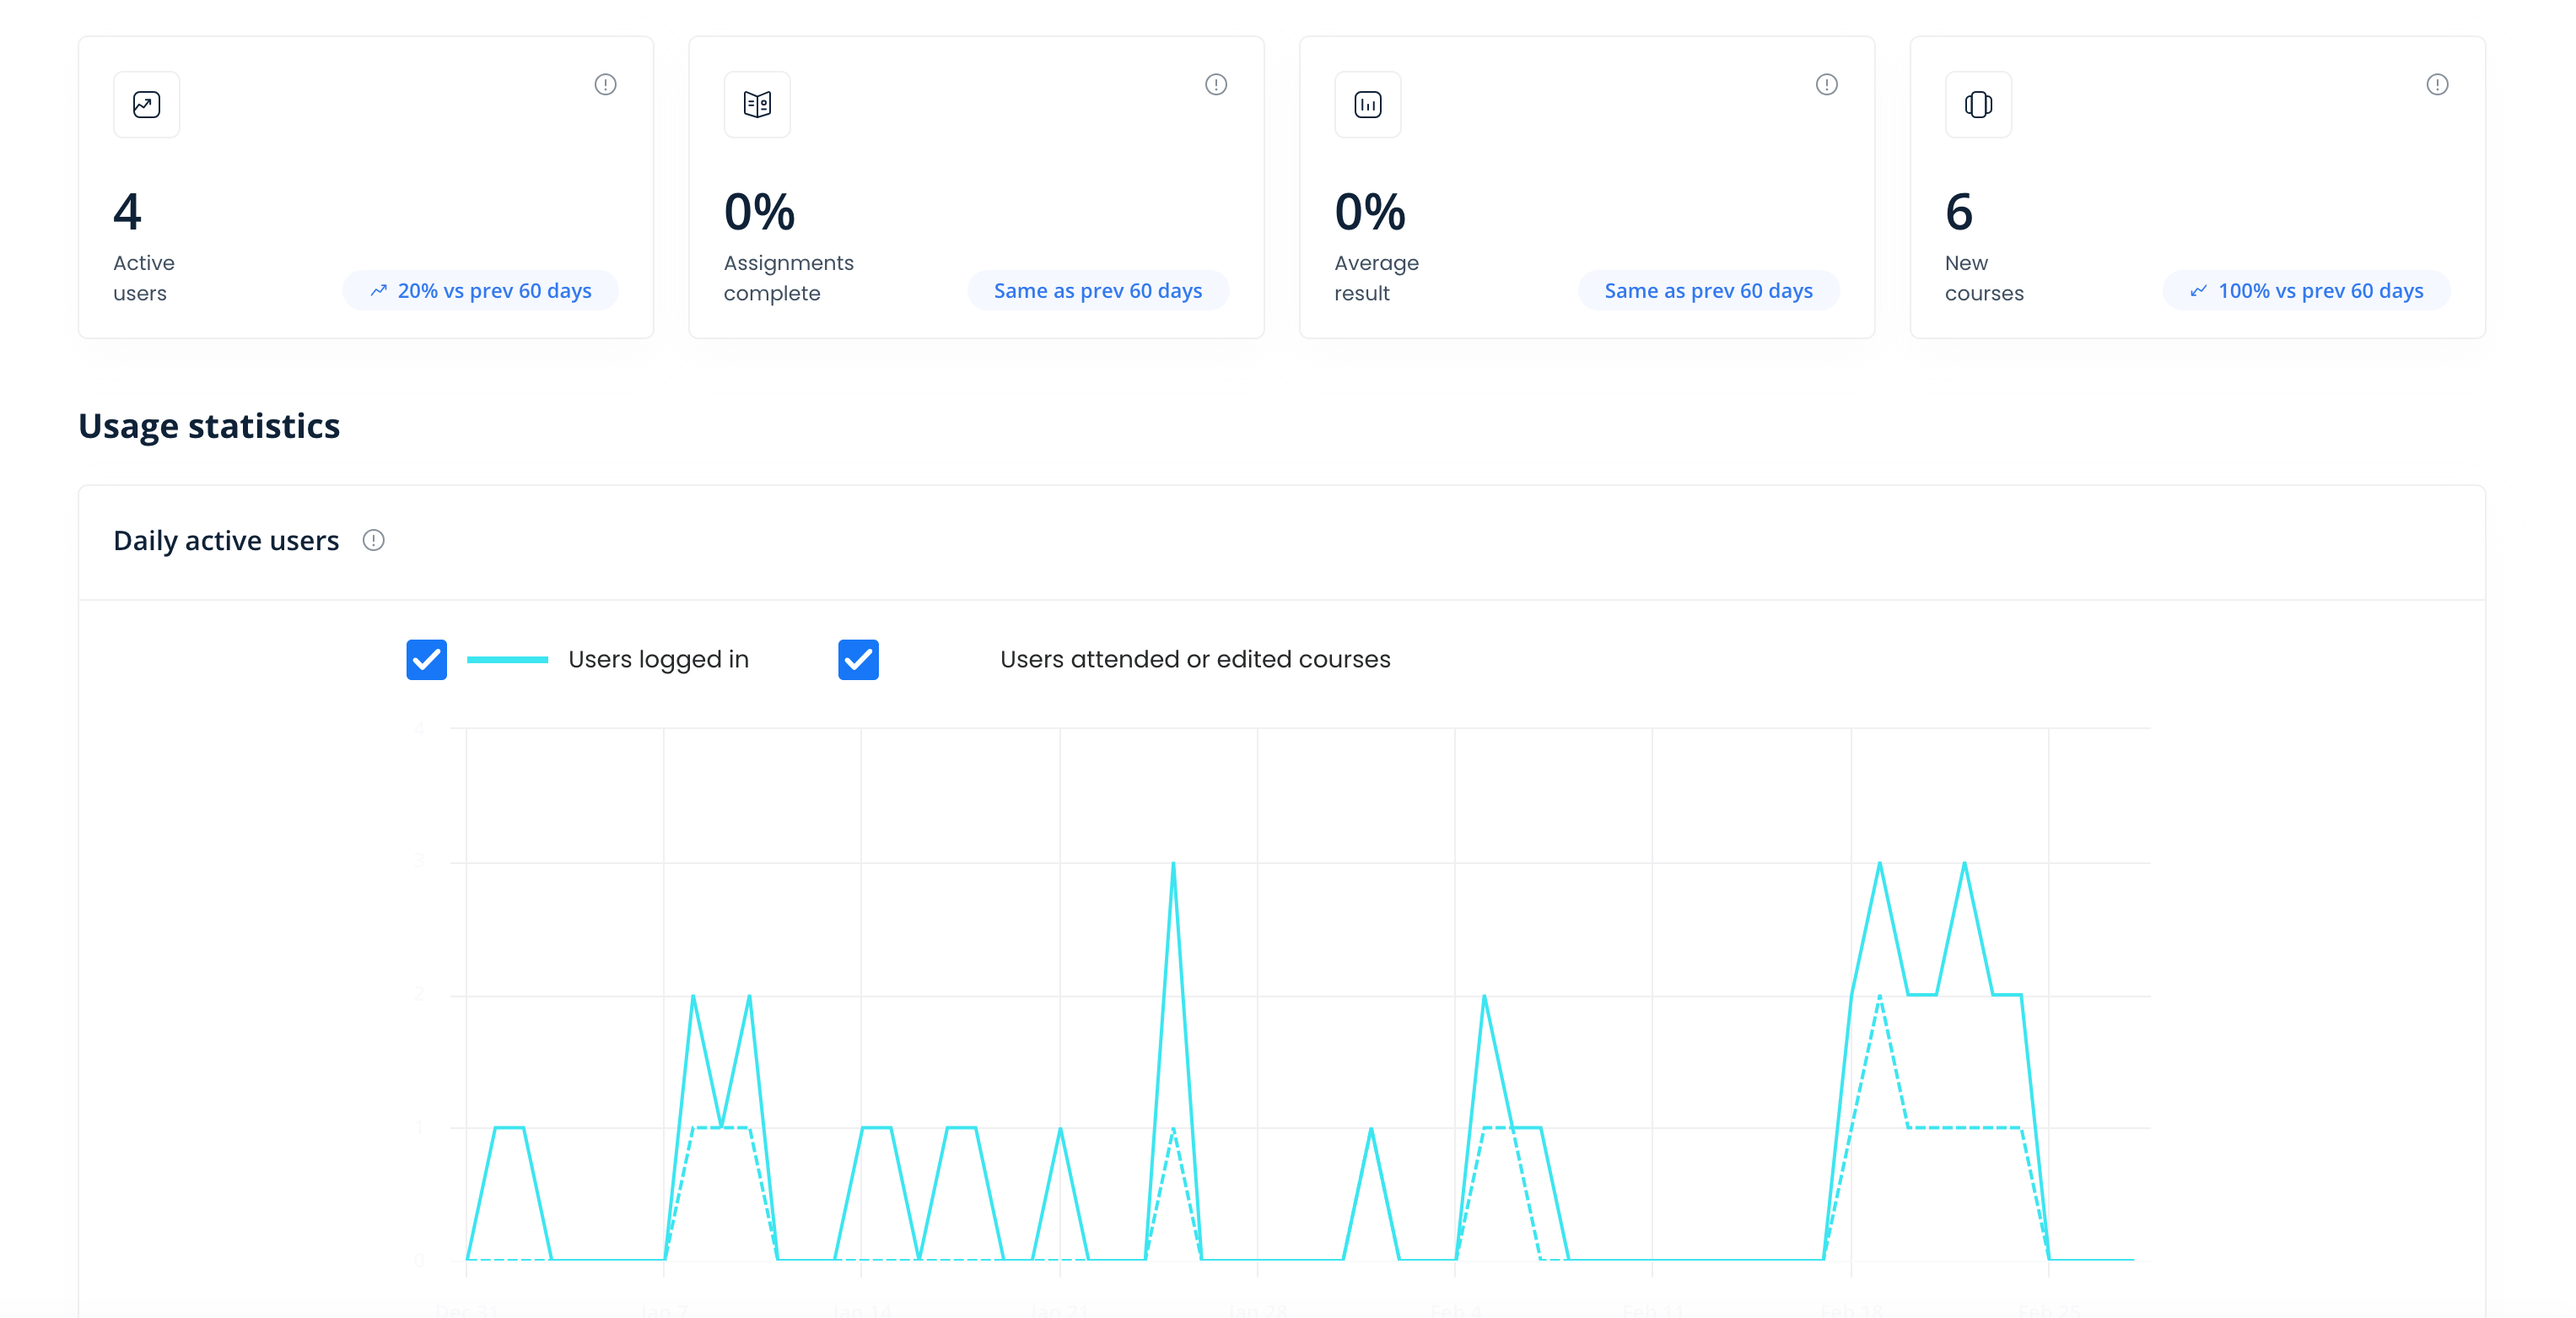
Overall Statistics
In this field, you will find indicators such as:
- Number of users assigned to the course
- Number of users in the process of taking the course
- Total number of course completion attempts by all assigned users
- Average score across all completions
The average score can help you, as the course author, draw conclusions about the difficulty or quality of the course. For example, if most users are struggling with the course, consider making changes to the course structure or content.
User Progress Distribution
This graph will show you at which stage of course completion all users currently enrolled in this course are.
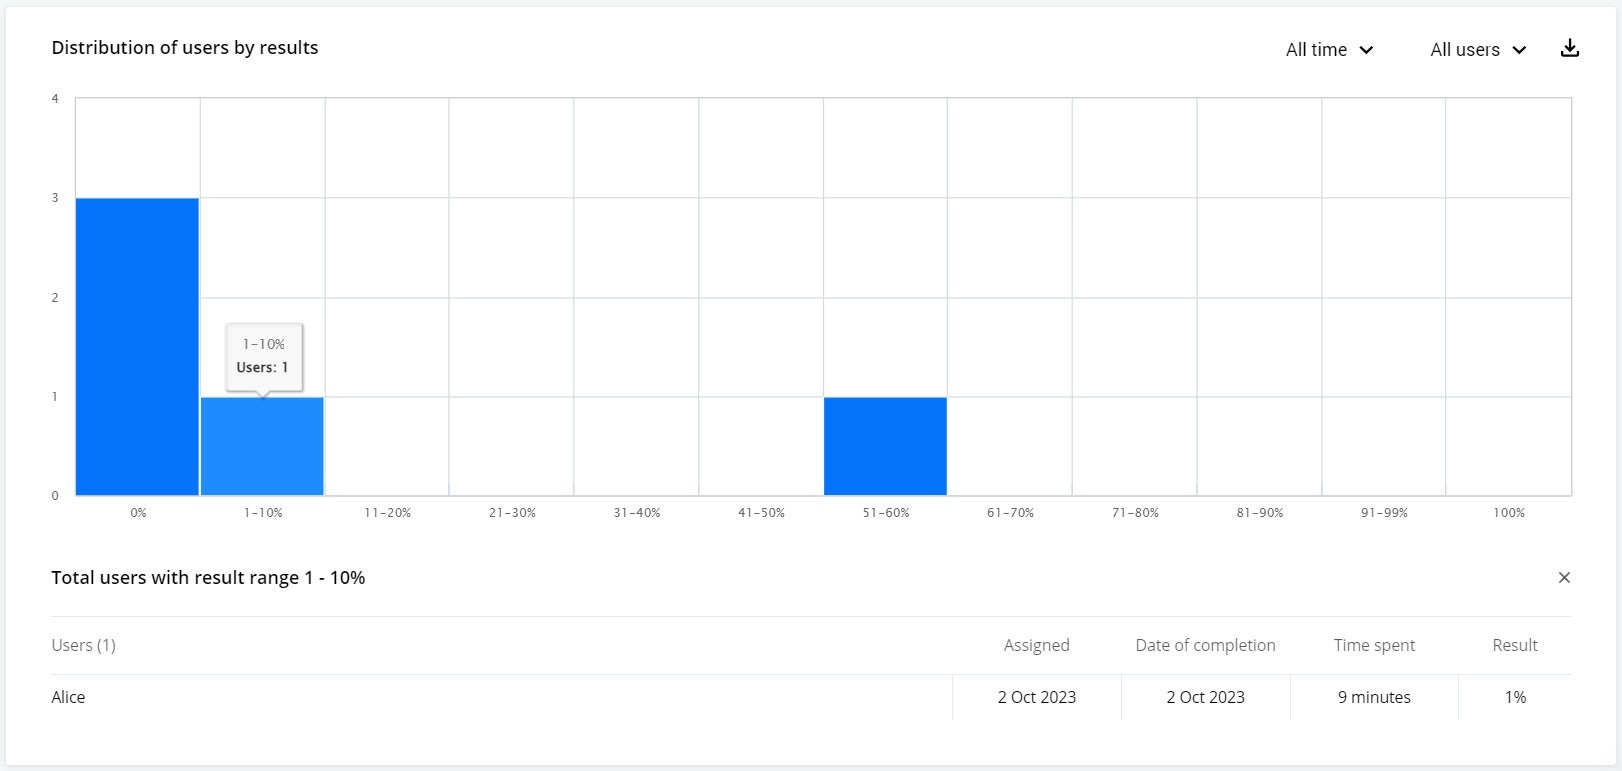
Results Distribution
This graph reflects the results of completing this course by all users who have finished it.
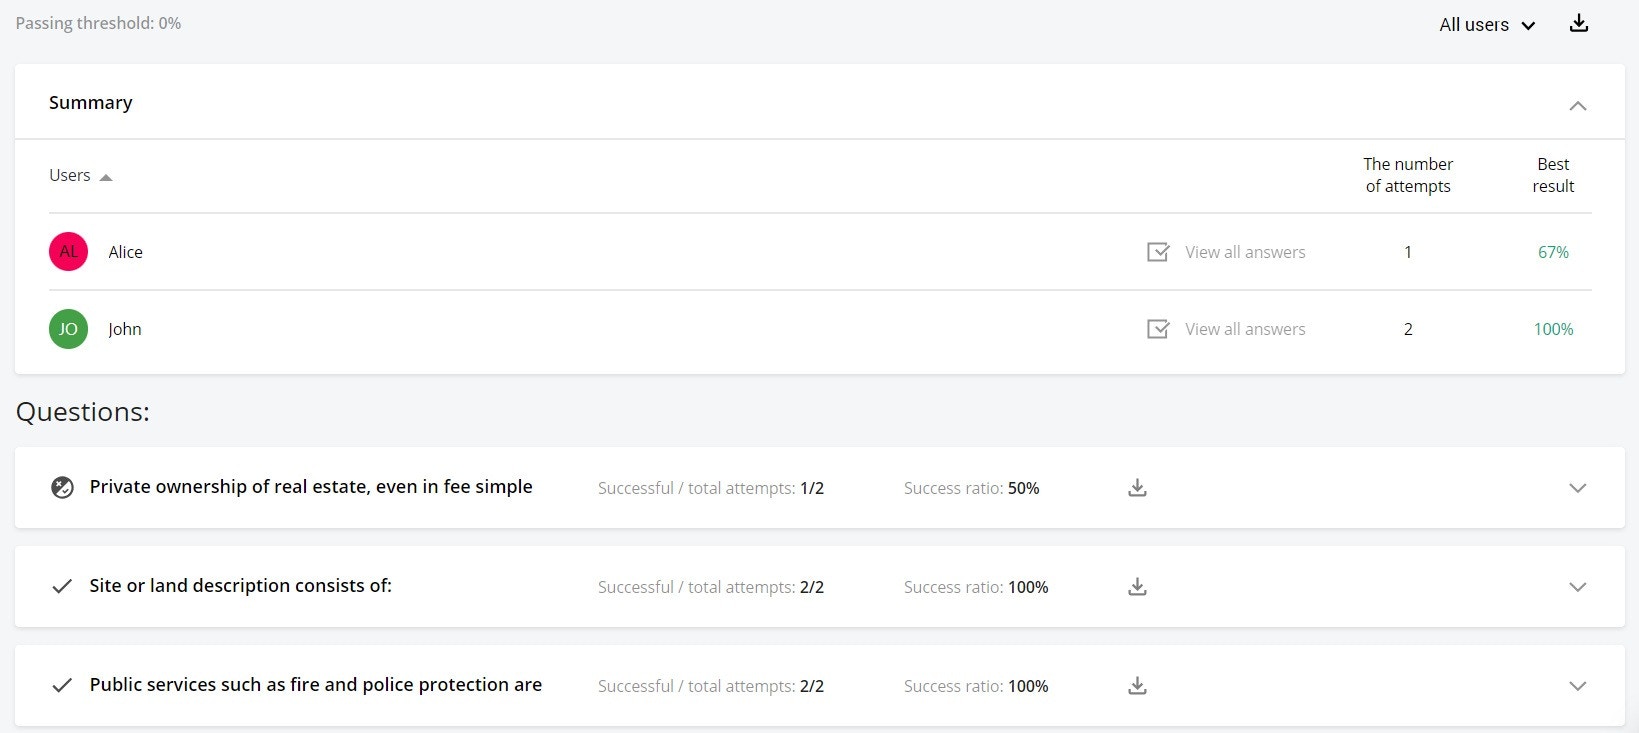
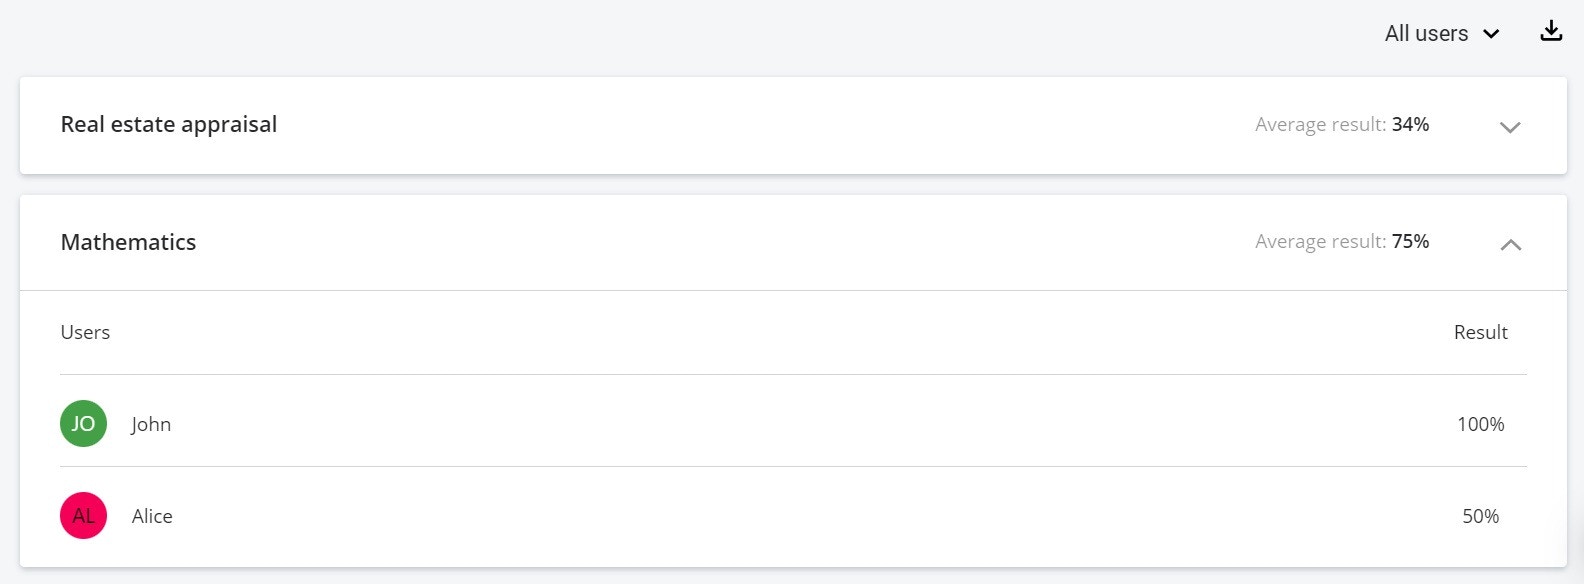
Tests
For each test in the course, a separate statistics section is displayed in this field. Click on the course name to access detailed information and the average result for each question or user.
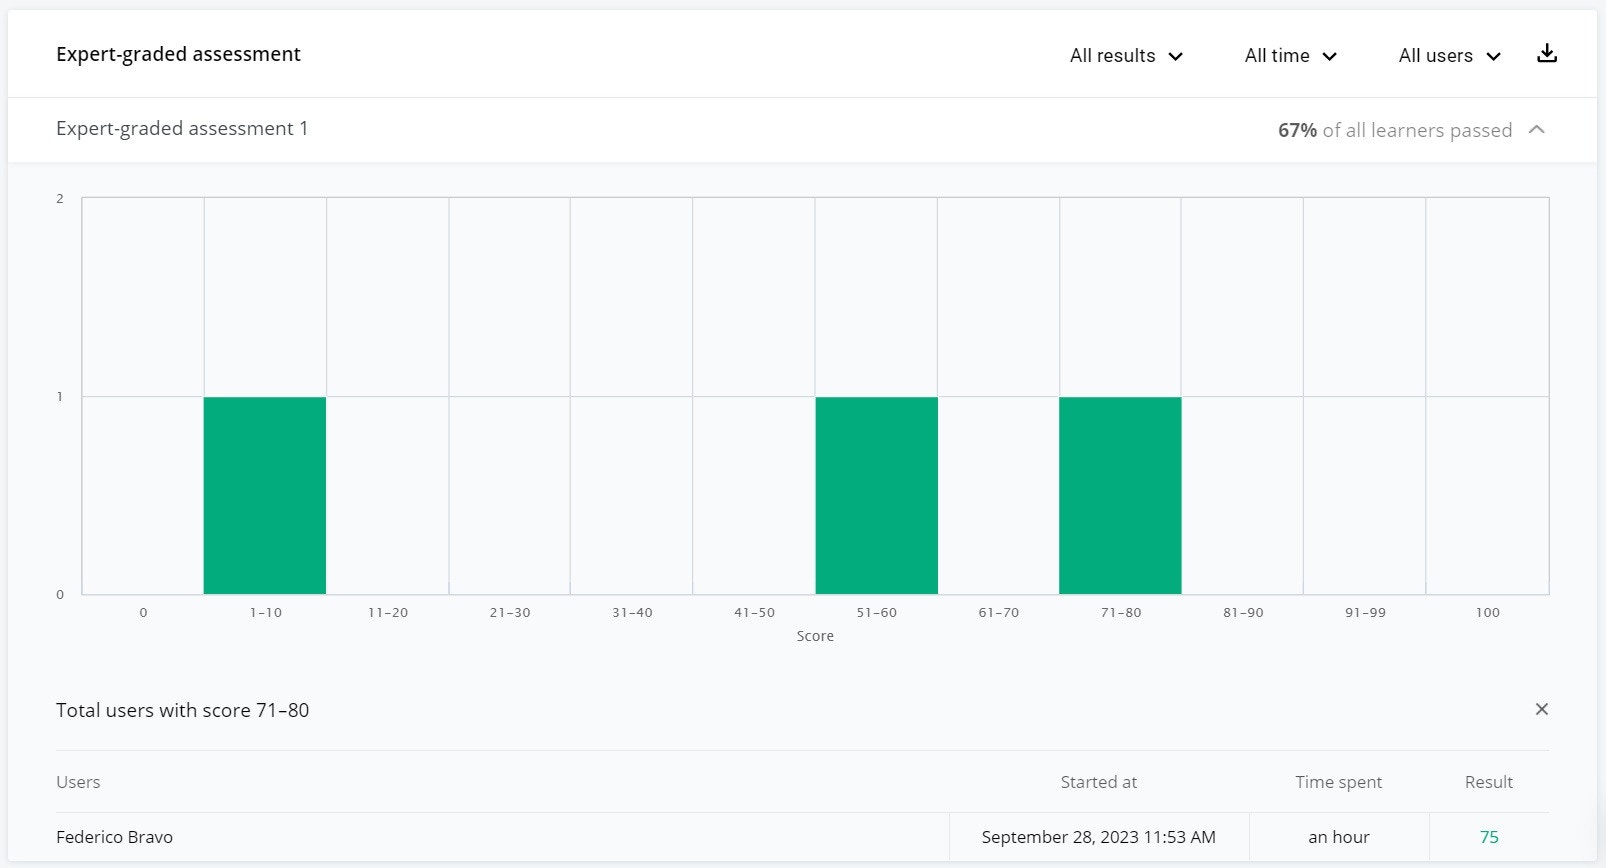
Homework
Review information about completed homework assignments for this course. You can sort the data by results, time intervals, or users.
Skills
All skills evaluated by the course tests will be displayed in this field. Click on the arrow to expand detailed user data.
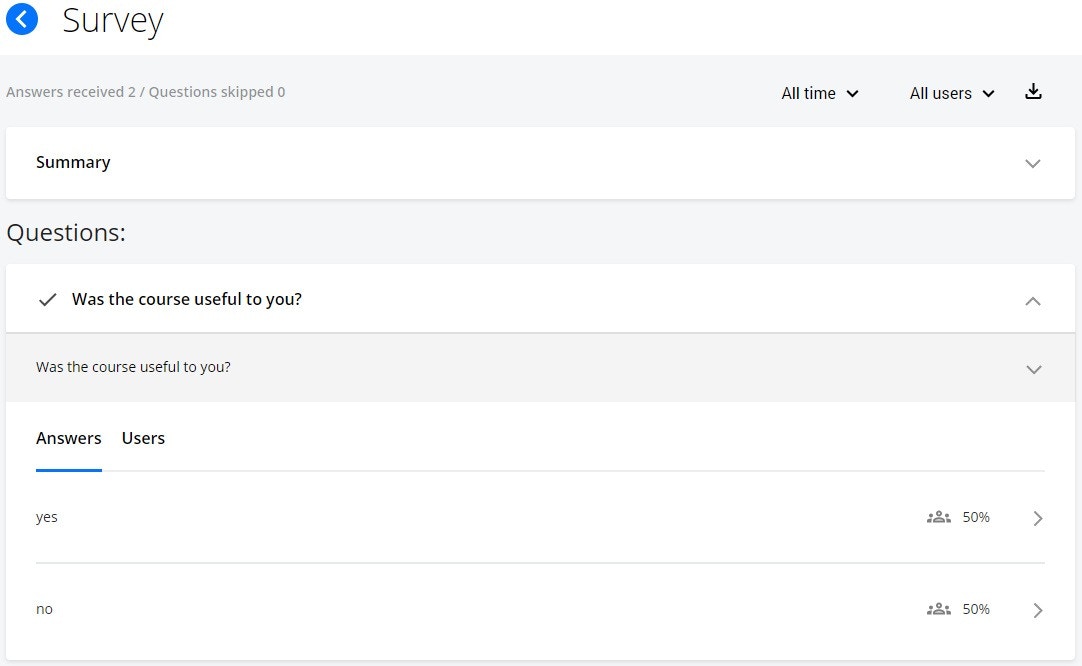
Poll Statistics
Switch to the “Poll Statistics” tab to analyze the feedback received from students in this course.
Each question is presented in a separate field and shows the number of responses received or open responses from students.
Best Practices
- Monitor regularly: Check course statistics frequently to identify issues early
- Export data: Use CSV exports for deeper analysis in spreadsheet applications
- Track trends: Compare statistics over time to see if changes improve outcomes
- Focus on outliers: Pay attention to questions or sections where many students struggle
- Use feedback: Review poll statistics to understand learner satisfaction and areas for improvement
- Set benchmarks: Establish target average scores and completion rates for your courses
- Iterate based on data: Use statistical insights to continuously improve course content and structure